Edited by Simisola Fagbola, Econoday Economist
The Economy
Monetary policy
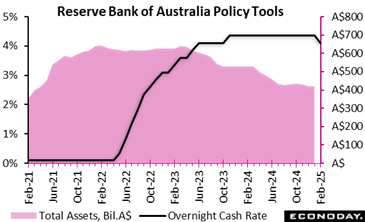 The Reserve Bank of Australia lowered its main policy rate, the cash rate, by 25 basis points from 4.35 percent to 4.10 percent at its meeting today, in line with the consensus forecast. This is the first reduction in the rate since 2020 and the first change in the rate since an increase of 25 basis points in December 2023. The rate decision coincided with the publication of updated economic forecasts in the quarterly Statement on Monetary Policy.
In the statement accompanying today’s decision, official noted recent declines in inflation and expressed optimism that “inflationary pressures are easing a little more quickly than expected”. This, they judge, provides more confidence that inflation is moving sustainably to towards the midpoint of their target range of 2 percent to 3 percent, though they cautioned that upside risks remain. Despite ongoing tightness in the labour market, officials are also uncertain about growth prospects, reflecting both external risks and the outlook for domestic household consumption.
Reflecting these considerations, officials concluded that a rate cut was warranted today but they also stressed that further policy loosening is not assured at this stage. The statement explicitly notes that officials are “cautious on prospects for further policy easing” and also warns that “if monetary policy is eased too much too soon, disinflation could stall”.
This caution about prospects for additional policy easing reflects the fact that officials have revised their longer-term inflation forecasts higher. Headline inflation is now forecast to be 3.7 percent at end-2025, unchanged from the previous forecast of 3.5 percent, but then fall to 3.2 percent at mid-2026 and 2.8 percent at end-2026, up from the previous forecasts of 3.1 percent and 2.5 percent respectively. The forecast for the trimmed mean measure of inflation at end-2026 has also been revised up from 2.5 percent to 2.7 percent. Both measures of inflation are forecast to be at 2.7 percent mid-2027.
Officials have made little change to growth forecasts. Australia’s economy is now forecast to expand by 2.4 percent on the year in the three months to December 2025, up from 2.3 percent previously, and by 2.3 percent in the three months to December 2026, up from 2.2 percent previously.
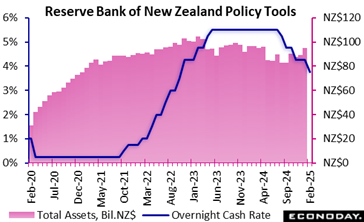 The Reserve Bank of New Zealand’s Monetary Policy Committee has cut the official cash rate by 50 basis points from 4.25 percent to 3.75 percent, in line with the consensus forecast. Officials have now lowered policy rates by a cumulative 175 basis points over their last four meetings after an extended period of restrictive policy settings.
This aggressive easing in recent meetings has accompanied data showing a sustained fall in inflation. Headline CPI inflation fell from 4.0 percent in the three months to March to 3.3 percent in the three months to June and 2.2 percent in the three months to both September and December, with core inflation falling from 3.7 percent to 2.8 percent and then 2.7 percent over this period.
In the statement accompanying today’s decision, officials expressed confidence that inflation will remain within this range over the medium-term, despite their expectation that exchange rates and fuel prices may cause some volatility. They also reiterated their confidence that economic growth will recover this year in response to the recent reductions in policy rates.
Reflecting this assessment, officials concluded that there is now scope to lower policy rates again today. Moreover, they also advise that they expect to loosen policy further if “conditions continue to evolve as projected”.
Inflation
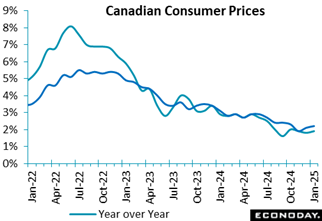 Canada’s Consumer Price Index was up 0.1 percent in January on a monthly basis, after contracting by 0.4 percent in December, matching expectations in the Econoday survey of forecasters.
Compared to January 2024, the CPI is up 1.9 percent, speeding up slightly from the 1.8 percent pace set in December, and just above expectations for a 1.8 percent rise in the Econoday survey of forecasters.
Excluding food and energy prices, the CPI fell 0.1 percent on a monthly basis, following a similar rate of decline in December. Compared to a year ago, the core CPI is up 2.2 percent in January vs. a 2.1 percent increase in December.
The average of the Bank of Canada’s ‘Alternative measures’ of annual core inflation for January is 2.7 percent, up from 2.5 percent in December.
The inflation data remains in line with the Bank of Canada’s outlook for consumer prices, but lurking in the background is the specter of a potential trade war with the United States. The Bank of Canada included a scenario in its latest monetary policy report predicting higher inflation, as well as a a contraction in economic activity, should the U.S. government impose punitive tariffs on Canadian exports.
As for January’s CPI increase, StatsCan said higher energy prices, particularly for gasoline and natural gas, contributed the most to the acceleration. Partially offsetting these increases was the continued downward pressure on the cost of products affected by the goods and services tax/harmonized sales tax break introduced in December.
The major components impacted by the tax break are food; alcoholic beverages, tobacco products, and recreational cannabis; recreation, education, and reading; and clothing and footwear.
Food prices fell 0.6 percent on an annual basis in January, the first yearly decrease since May 2017, “driven by a record decline in prices for food purchased from restaurants (-5.1 percent).” The CPI excluding food rose 0.2 percent on a monthly basis, and +2.4 percent on an annual basis in January.
Compared to a year ago, gasoline prices jumped 8.6 percent in January, building on a 3.5 percent increase in December. On a monthly basis, gasoline prices surged 4 percent in January following a 0.6 percent contraction in December. Consumer prices excluding gasoline rose 1.7 percent year over year last month, after rising by 1.8 percent in December and 2 percent in November.
Shelter price growth continued to slow down but remains elevated – rising 4.5 percent year over year, the same rate as in December.
Prices for goods are up 0.9 percent from a year ago in January, after a 0.1 percent drop in December. Meanwhile, service price inflation slowed down to a 2.8 percent rise in January, following a 3.5 percent jump in December.
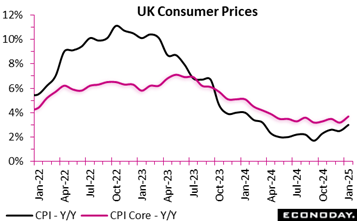 The latest inflation report reveals a resurgence in price pressures, with the consumer price index rising by 3.0 percent in January on a year-over-year basis, up from 2.5 percent in December 2024 and 0.2 percentage points above the consensus. This acceleration is primarily driven by core inflation, which excludes volatile items such as energy and food, increasing to 3.7 percent from 3.2 percent. The service sector continues to exert upward pressure, with CPI services inflation rising from 4.4 percent to 5.0 percent, indicating persistent cost pressures in labour-intensive industries.
Despite the annual increase, monthly CPI fell by 0.1 percent, a reversal from December’s 0.3 percent rise. This suggests a short-term reprieve, likely influenced by weaker seasonal demand. The CPI, including owner-occupiers’ housing costs (CPIH), climbed 3.9 percent, with transport and food costs being the primary inflationary drivers, while housing and household services provided some relief.
A more concerning trend is the steady rise in core CPIH, which rose 4.6 percent, reflecting sustained underlying inflationary pressures. The divergence between goods and services inflation, with services inflation nearly six times higher, signals persistent cost-push factors that could challenge monetary policy decisions in the coming months.
Employment
 Despite a year-over-year rise of 95,000 (0.3 percent) in payrolled employees in December 2024, recent trends indicate a downturn, with monthly decreases in both November (32,000) and December (47,000), suggesting emerging economic uncertainties.
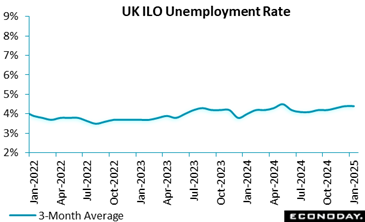
The employment rate (74.8 percent) remained steady over the year but saw a quarterly decline, aligning with a rise in unemployment (4.4 percent). Economic inactivity (21.6 percent) continued its downward trend, hinting at gradual workforce re-engagement. However, the Claimant Count increased by 22,000, reaching 1.750 million in January, reflecting growing pressure on jobseekers.
Vacancy numbers continued their 30-period decline, falling by 24,000 to 812,000, although they remained above pre-pandemic levels. This sustained reduction, alongside a rise in labour disputes, highlights underlying workforce tensions.
Earnings growth remained strong at 5.6 percent, with real-term increases (2.5 percent for regular pay) outpacing inflation. This signals resilient wage growth despite broader employment challenges. However, the ongoing volatility in labour force survey estimates necessitates cautious interpretation, reinforcing the need for a holistic approach using alternative indicators such as PAYE RTI and workforce job data.
GDP
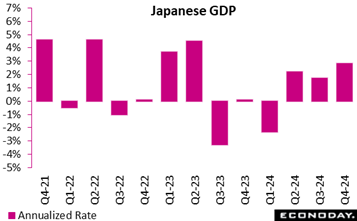 Japan’s gross domestic product for the October-December quarter posted its third consecutive growth, accelerating back to 0.7% on quarter, or an annualized 2.7% after a third quarter slowdown, but it was largely due to a technical rebound in net exports, up 0.7 percentage point (after four quarters of drops), that was caused by a sharper-than-expected slump in imports and masks weak exports. Domestic demand trimmed total domestic output by 0.1 point in Q4 after boosting the Q3 GDP by 0.5 point. China is struggling to recover from the property market slump and demand for Japanese vehicles and construction machinery in the U.S. market is fading under the weight of high borrowing costs. Private consumption rose slightly instead of an expected slip but remains sluggish amid high costs and depressed real wage growth.
The much higher than expected Q4 growth (consensus was +0.3% q/q, +1.3% annualized) follows an upwardly revised 0.4% rise (annualized 1.7%) in the July-September quarter, when an unexpected slip in external demand amid sapping Chinese demand and global uncertainties was offset by surprisingly solid consumer spending on vehicles amid high costs for necessities and stormy weather. The Q4 performance more or less matched an upwardly revised 0.7% growth (annualized 3.0%) in April-June. The economy contracted a revised 0.5% (annualized 1.9%) in the first three months of 2024
From a year earlier, Japan’s GDP posted a second straight increase, up 1.6% (well above the consensus call of +0.6%), after rising 0.6% in Q3 and falling 0.8% in Q2.
Many households in Japan remained frugal toward the end of the year amid surging food prices in light of lingering domestic rice shortages and weak yen-induced high import costs as well as elevated utilities after the government ended subsidies aimed at reducing air conditioning costs during the protracted hot and humid weather into the fall. Business investment picked up slightly from a slip in July-September but was not strong enough to lead Japan’s Goldilocks economy in the face of global uncertainties heightened by U.S. President Donald Trump’s protectionist trade policy. Labor shortages and high materials costs are also hurting the construction industry in Japan and putting a damper on capital investment and public works spending, the latter of which is losing steam after the stimulative effects of supplementary budgets had run its course.
Looking ahead, Japan’s economic growth in the January-March quarter is expected to remain subdued as consumers stay frugal and firms are still cautious about implementing their solid capex plans. Many firms’ plans to invest in new capacity are supported by demand for automation amid widespread labor shortages as well as government-led digital transformation and emission control.
The key components in percentage change on quarter except for private inventories and net exports, whose contributions are in percentage points. Figures in the previous quarter are in parentheses:
GDP q/q: +0.7% (+0.4%); 3rd straight growth
GDP annualized: +2.8% (+1.7%); 3rd straight growth
GDP y/y: +1.2% (+0.6%); 2nd straight rise
Domestic demand: -0.1 point (+0.5 point); 1st drop in 3 qtrs
Private consumption: +0.1% (+0.7%); 3rd straight rise
Business investment: +0.5% (-0.1%); 1st rise in 2 quarters
Public investment: -0.3% (-1.1%); 2nd straight drop
Private inventories: -0.2 point (+0.2 point); 1st drop in 2 qtrs
Net exports (external demand): +0.7 point (-0.1 point); 1st clear rise in 6 qtrs
Housing
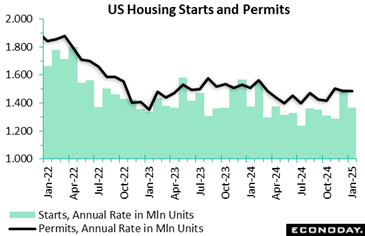
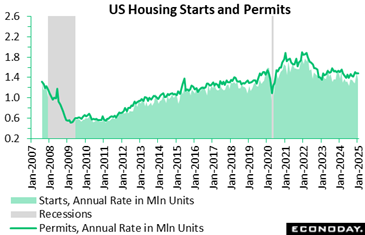 Housing starts decline in January (likely a combination of bad weather and high mortgage rates) after a surge in December, coming in at a seasonally adjusted annual rate of 1,366,000, 9.8 percent below December’s revised 1,525,000 (previously 1,499,000). Expectations in the Econoday survey of forecasters was for an annual rate of 1,397,000.
 New residential construction is just 0.7 percent lower than the January 2024 rate of 1,376,000.
January’s single-family housing starts were at a rate of 993,000, 8.4 percent slower than December’s revised number of 1,084,000 (previously 1,050,000). The January rate for multi-family housing units was 355,000, compared to 399,000 in December.
U.S. building permits in January were at a seasonally adjusted annual rate of 1,483,000. This is 0.1 percent above the revised December rate of 1,482,000 (previously 1,483,000) but is 1.7 percent below the January 2024 rate of 1,508,000.
Permits to build single-family homes in January were at a rate of 996,000; same as the revised December figure (previously 992,000). Permits to construct buildings with five units or more were at a rate of 427,000 compared to 433,000 in December.
US Review – Week ended February 21, 2025
Between the drop in the February NAHB/Wells Fargo housing market index by 5 points to 42 and the 4.9 percent fall in January existing home sales to 4.08 million units, there are emerging signs of weakening in the housing market. Despite moderation in home prices, builders and buyers are reacting to uncertain economic conditions with increased caution. Builders aren’t as optimistic about the outlook despite the prospect of loosened regulation. They are facing renewed upward price pressures on materials and labor, and potentially shortages of needed inputs. Consumers are worried about decreasing purchasing power with an uptick in inflation and their job security. And finally, there is little chance of meaningfully lower mortgage rates in the near future with the FOMC set to maintain restrictive monetary policy for the time being.
 Econoday’s Global Economics articles detail the results of each week’s key economic events and offer consensus forecasts for what’s ahead in the coming week. Global Economics is sent via email on Friday Evenings.
 The Daily Global Economic Review is a daily snapshot of economic events and analysis designed to keep you informed with timely and relevant information. Delivered directly to your inbox at 5:30pm ET each market day.
 Stay ahead in 2025 with the Econoday Economic Journal! Packed with a comprehensive calendar of key economic events, expert insights, and daily planning tools, it’s the perfect resource for investors, students, and decision-makers.